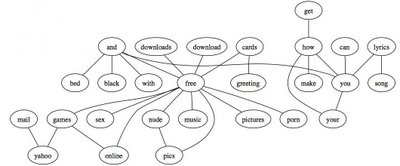
The AOL user query strings [1] were analyzed to count the number of times each word appears with each other word in a query, i.e., counts of"co-occurrences". (Each part of a domain name or URL is treated as a separate word. Words with less than three characters, and the words "for", "the", "www" and "com" where ignored.) The result can be drawn as a graph, where nodes are words and arcs mean they co-occur at least 10000 times in the ~20 million-query database. This image shows the largest connected subgraph of the result, rendered using graphviz.
[1] G. Pass, A. Chowdhury, C. Torgeson, "A Picture of Search" The First International Conference on Scalable Information Systems, Hong Kong, June, 2006.

